informatik


The following section summarizes the experience from analyzing several sequence datasets. It assumes that you have the example alignment for HIV-1 subtyping packaged with SlidingBayes (beware: the file ending is wrong). First, make sure the following options are enabled: View=>Show P-Value Inspector, View=>Show Optimal Solution Only, Settings=>Analyze single sequence only, Settings=>Autostart.
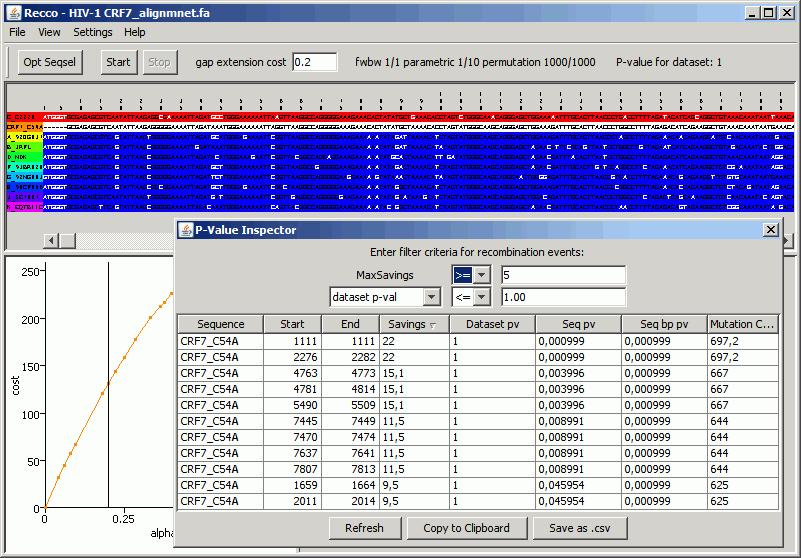
Load the FASTA file by clicking File=>Open. Click on the sequence name CRF7_C54A in the central view of the alignment and wait for the analysis to finish.Sort the results in the P-Value Inspector by clicking on the Savings column. You should get an output similar to this:

The P-Value Inspector shows a recombination event in each row. As they are ordered by Savings, the recombination events are listed in the order that they are inserted into the optimal solution. To be more specific, the first optimal solution does not incur recombination at all and explains CRF7_C54A only with the closest sequence. The optimal solution that allows for a bit more recombination inserts the recombination event shown on top of the P-Value Inspector and incurs 22 (=Savings) fewer mutations than the solution without recombination. In essence, the recombination events are ordered by their significance - the lower recombination events always include the recombination events shown above them.
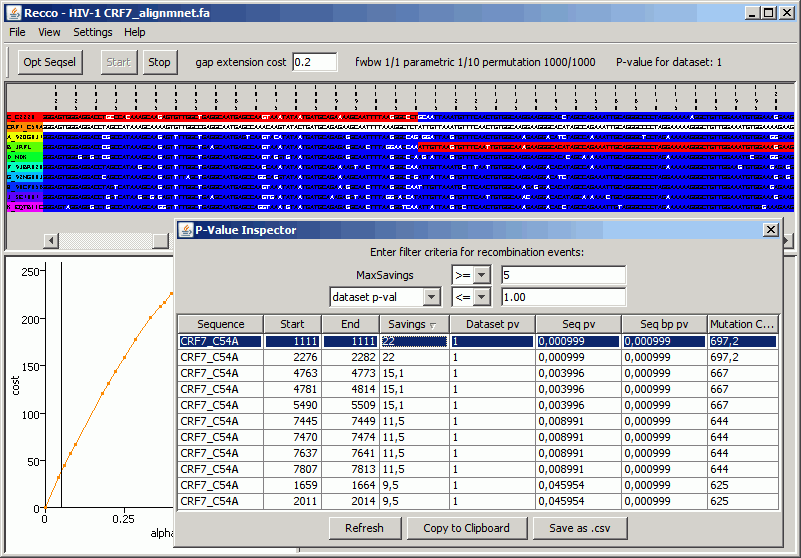
Now click on the first row. The alignment view updates to show the recombination event in more detail:

As you can see, the recombination event occurs between sequence C_C2220 and B_JRFL and even makes sense in the close proximity of the predicted breakpoint position. Note that in general this does not have to be the case as Recco can detect long-range effects as well.
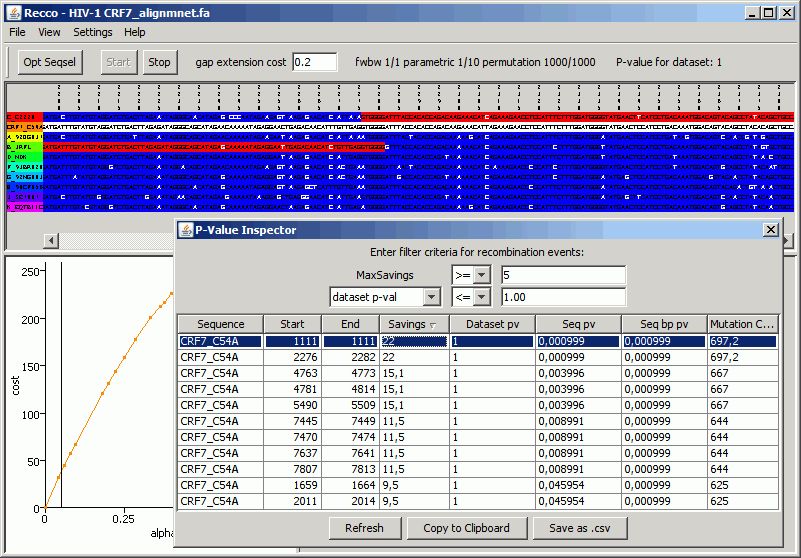
Now scroll the alignment from left to right to find out about the structure of the optimal solution. There is actually another recombination event occuring towards the end of the alignment:

Apparently, the first and the second recombination event in the P-Value Inspector were inserted into the optimal solution simultaneously. This happens if both recombination events save the same amount of mutations. To be more accurate, in this case the first and the second recombination event save each 22 mutations with respect to a solution without recombination. The optimal solution that includes both recombinations incurs 697,2 mutations (fractions are due to the scoring of gaps with 0,2). The closest sequence to CRF7_C54A therefore incurs 697,2+2*22=741,2 mutations.
Now check the third, fourth and fifth row of the P-Value inspector: all three recombination events have the same Savings value and are also introduced simultaneously. Interestingly, the third and fourth recombination event predict a recombination breakpoint that is very closeby - click on the third recombination event to see yourself. Both rows actually only represent a single recombination event from C_C2220 to B_JRFL that occurs at positions 4763-4773 or 4781-4814. Apparantly, a recombination between 4774 and 4780 would incur one additional mutation for the optimal solution and forces the P-Value Inspector to split it up into several rows. The same phenomen occurs also for rows 6-9, which only represent two recombinations.
To find out whether the recombination events 3 to 5 should be part of the optimal solution, check their p-value: Seq pv is the p-value for the Savings feature regarding the Sequence shown in the first column and is highly significant. The same holds for recombination events described in rows 6 to 9. However, the next two recombination events only eliminate 9,5 mutations and have a p-value of about 0,04. As Seq pv does not correct for multiple testing, and the further you progress down in the list of recombination events, the more susceptible the results are regarding the multiple testing problem. I would therefore suggest that these two recombination events are borderline cases. Manual inspection actually reveals that the recombination events also incur the sequences C_C2220 and B_JRFL.
The main conclusion is therefore that CRF7_C54A is a recombinant with two parental sequences C_C2220 and B_JRF and six to eight recombination breakpoints.
A note on the filter dialog in the P-Value Inspector: the default criterion Savings>=5 actually helps to filter noise from the data. Even though you can lower this number and rely on p-values only, you might end up with more spurious results. There are cases when p-values are significant even though the recombination even saves only two mutations, and this may happen by pure chance. Therefore, I suggest to leave the filter setting at Savings>=5.
The Seq bp pv column in the P-Value Inspector is not really relevant. The Dataset pv column is a bit more conservative than the Seq pv, but Seq pv has a clearer interpretation from a statistical viewpoint. Hence, I suggest that you do not use Dataset pv and Seq bp pv.
Also, the breakpoint P-values, which can be enabled (in the View menu, are notoriously noisy and not conservative. I suggest to disable them.
Finally, gaps are notoriously difficult to treat, and this does not only concern Recco! The default setting of a gap extension cost of 0.2 worked well for this study, but the main problem remains: large gaps can induce recombinations - and it is not clear how this should be interpreted biologically.